
DeepDojo.AIPublished 2026-11-12中文
Troubleshooting Claude Code Errors Layer by Layer
A build fails, and the log shows four lines in a row:
14:02:11 PreToolUse hook "format.py" exit code 1
14:02:11 file not formatted
14:02:12 test failed: syntax error in app.ts
14:02:15 build aborted
It's tempting to read straight down by timestamp, conclude the formatting script broke app.ts, and go fix format.py. But time order is only a clue: the formatting failure and the syntax error could be two unrelated problems. Fix one, and the other is still there.
When Claude Code runs into trouble, the interface often shows only the last error, while a single operation may have passed through the session, instruction loading, Settings, permissions, Hooks, MCP, and external services. Changing configuration based on that last message often changes the wrong thing. Change several things at once, and even if the problem goes away, you can't say which change did it.
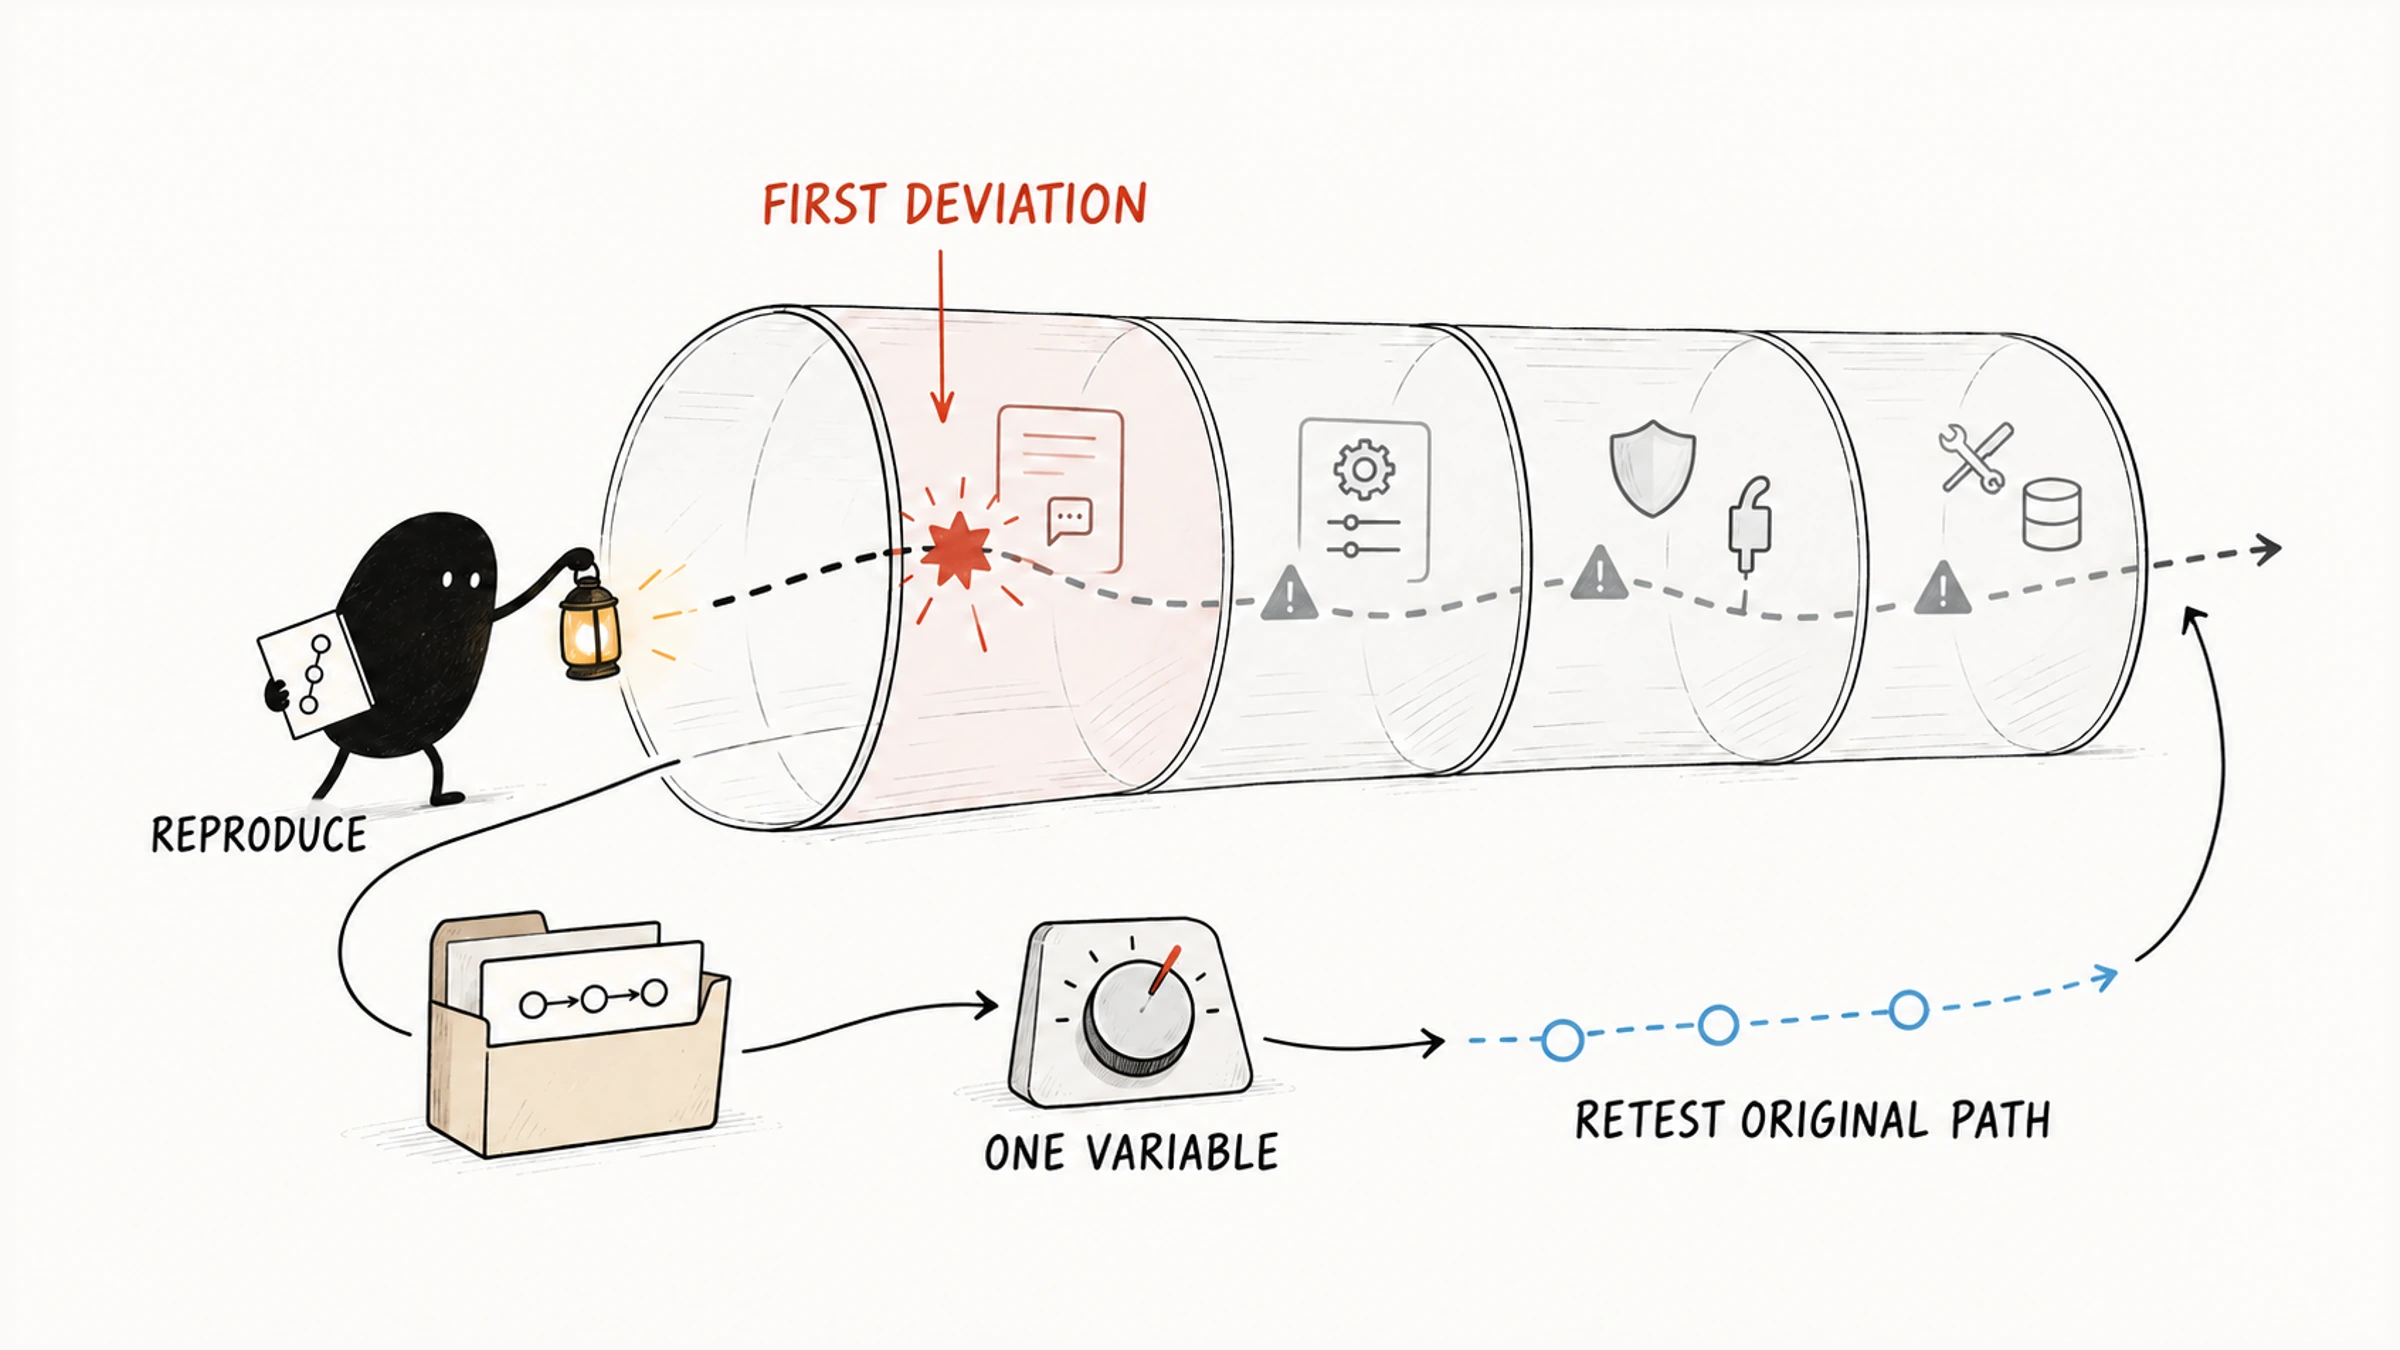
A steadier approach has three steps:
- write a reproducible failure record: what you did, what you expected, what you actually saw, and whether the environment changed;
- assign the symptom to one layer and gather evidence with that layer's tools;
- find the earliest error in the log, fix it, and then retest the later results one by one.
We'll start with the failure record, then the evidence tools for each layer, and finally come back to those four log lines.
01 Start with a Reproducible Record
Record the shortest reproduction first, then change one key factor at a time. If you change configuration, switch models, and reinstall all at once, the problem may vanish without telling you which change mattered. A record should include at least:
- the specific action you took and the result you expected;
- the exact error text or the unexpected behavior;
- whether it reproduces reliably, and the shortest steps to reproduce it;
- the current Claude Code version, model, account, and working directory;
- when the problem started, and whether you upgraded or changed configuration in the meantime.
With the time, the input, and what changed in between, you can form a hypothesis worth checking first. For example, if a slash command suddenly changes its output format and someone added a same-named Skill in the meantime, "name override" is the first lead to chase; the full walkthrough is in Claude Code Skill missing from the slash menu?.
02 Assign the Symptom to a Layer
Then place the symptom in its most likely layer:
Won't start or log in        → installation, version, authentication, network
Slow or confused replies     → context, model, network, external tools
Rule or Skill not applied    → configuration discovery and precedence
Tool denied                  → permissions and sandbox
Hook didn't fire             → registration, matching, script, and exit result
MCP tool unavailable         → server configuration, startup, and authentication
Task stalls halfway          → background tasks, tool processes, or API errors
Narrow the investigation to one layer before touching configuration. By the end, you should have evidence you can reproduce. The official configuration debugging guide sums up configuration problems this way: when Claude ignores an instruction or a feature you configured doesn't appear, the cause is usually that the file didn't load, it loaded from a different location than you expected, or another file overrode it.
03 Get an Environment Baseline First
When Claude Code won't start properly, behaves oddly after an upgrade, can't parse its configuration, or has trouble with authentication or connectivity, start in the terminal with:
claude doctorInside a session, you can also use:
/doctor
/status
Per the CLI reference, claude doctor prints read-only installation and settings diagnostics without starting a session. /doctor is the in-session setup checkup, which proposes fixes and applies them once you confirm. /status shows the version, current model, account, connectivity, and Settings sources. Use these as your environment baseline, then gather evidence for the specific problem.
04 Evidence Tools for Each Layer
Slow responses: /context shows what's in the current context and offers optimization suggestions. If one task has piled up long logs and unrelated history, use /compact to tidy it; when switching tasks, use /clear or a new session.
Slowness doesn't always come from context. First figure out whether the wait happens before the first output, during output, or after a particular tool call, then check the matching timing and errors:
| Where It Waits | What to Check First |
|---|---|
| Before the first output | Network, proxy, model load, and input processing time; judge context effects only with evidence |
| During output | Transport, rate limits, and the related error and timing records |
| After a particular tool call | That Hook's timeout, or the MCP response |
An external service timeout needs its own timing and error records; compacting context blindly won't fix it.
Rules not followed: check the Memory files in /context first to see what actually loaded; /memory only gives you the file entries and can't prove the content reached the session. The full steps are in why Claude Code ignores your CLAUDE.md rules.
Tools denied or repeatedly prompting: use /permissions to see the final rules. Check which deny, ask, or allow matched, then look at managed policy, the sandbox, and workspace trust. Opening a single settings.json can miss other sources.
Hooks not working: use /hooks to confirm registration, then check the event, Matcher, command path, timeout, and exit code.
MCP tools unavailable: use /mcp to check whether the server is enabled, started successfully, and authenticated. A project MCP server may still be waiting for first-time approval, and a wrong relative path, environment variable, or subprocess directory can make a server keep disconnecting.
Confirm separately whether the call was allowed, the Hook fired, and MCP connected, then follow the actual chain to see how they affect each other.
05 Find the First Error in the Log
Interface messages often show only the final symptom; detailed logs reconstruct how it failed. Inside a session you can use:
/debug Why didn't the Hook fire?The docs describe /debug as enabling debug logging for the current session and having Claude diagnose using the log output and settings paths. From the terminal, you can also start with claude --debug or claude --debug-file <path>; --debug supports category filters, which must use the equals form, such as --debug='mcp,startup'.
Note when the reproduction started, then pull the relevant pieces by event, tool, server, or error code, and look at the first error, its triggering input, the configuration source, and the results around it. The full log buries what matters, and errors that follow in a chain aren't necessarily the root cause.
Back to those four lines. Check format.py's input and stderr first, then compare the formatting result, the syntax error in app.ts, and the build failure. Time order is only a clue; these lines alone don't prove the formatting failure caused the syntax error, and the two problems may be independent.
After fixing the earliest error, retest each later result. If you've narrowed the scope but still don't know which configuration item is responsible, the next step is a controlled comparison, covered in find the config breaking Claude Code with safe mode. A reproducible record, a layer, and the earliest error in the log give troubleshooting somewhere solid to start.